| .. | ||
| artillery | ||
| scripts | ||
| src | ||
| static | ||
| .babelrc | ||
| .eslintignore | ||
| .eslintrc | ||
| .gitignore | ||
| docker-compose.yml | ||
| Dockerfile | ||
| metrics.json | ||
| package.json | ||
| prometheus.yml | ||
| readme.md | ||
| yarn.lock | ||
leak
-
- Spawn a bunch of servers:
- another-fast: a node with a linear memory leak
- fast: a node with a linear memory leak
- slow: a node with a memory leak that grows very slowly
- plain: a node with no memory leak
-
- Spawn an artillery for each node that loads it with a small but constant stream of requests
-
- Spawn Prometheus that watches the cpu/memory of each node
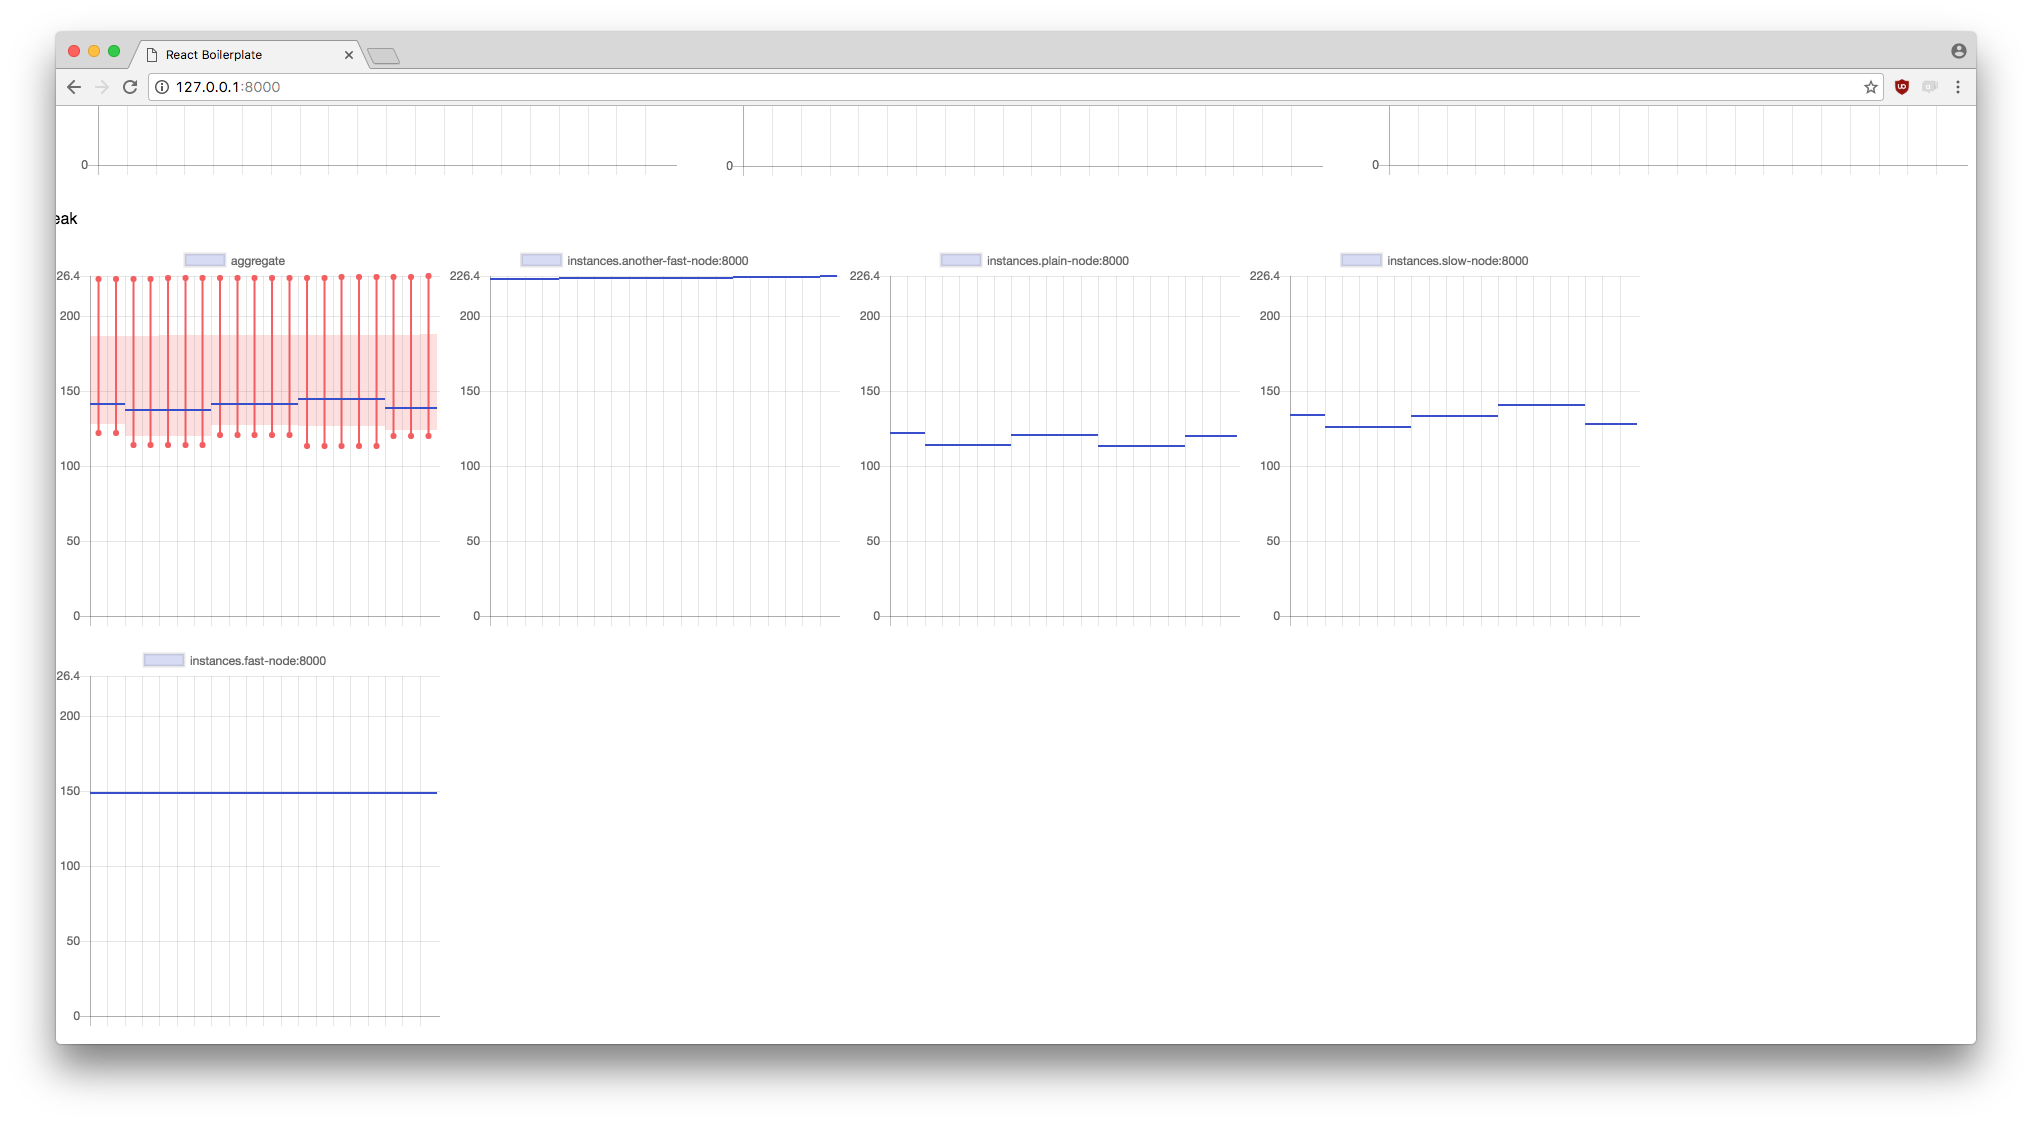
Then, locally we start the same server and we can see the different instances and an aggregate of the metrics for each job.
usage
λ docker-compose up
λ node .
Go to http://127.0.0.1:8000/ and see the result. The Prometheus is also listening at http://127.0.0.1:9090/
example